
Payout ratio = annual dividends divided by earnings. Or better, divided by free cash flow, which is harder to fake. A dividend lookup returns that one number per company in seconds. Reading it takes longer, because the same 60 percent can mean comfort at one company and strain at another. The trick is to start with the spread across the whole database, then place the company you are looking at inside it.
The spread across 195 companies
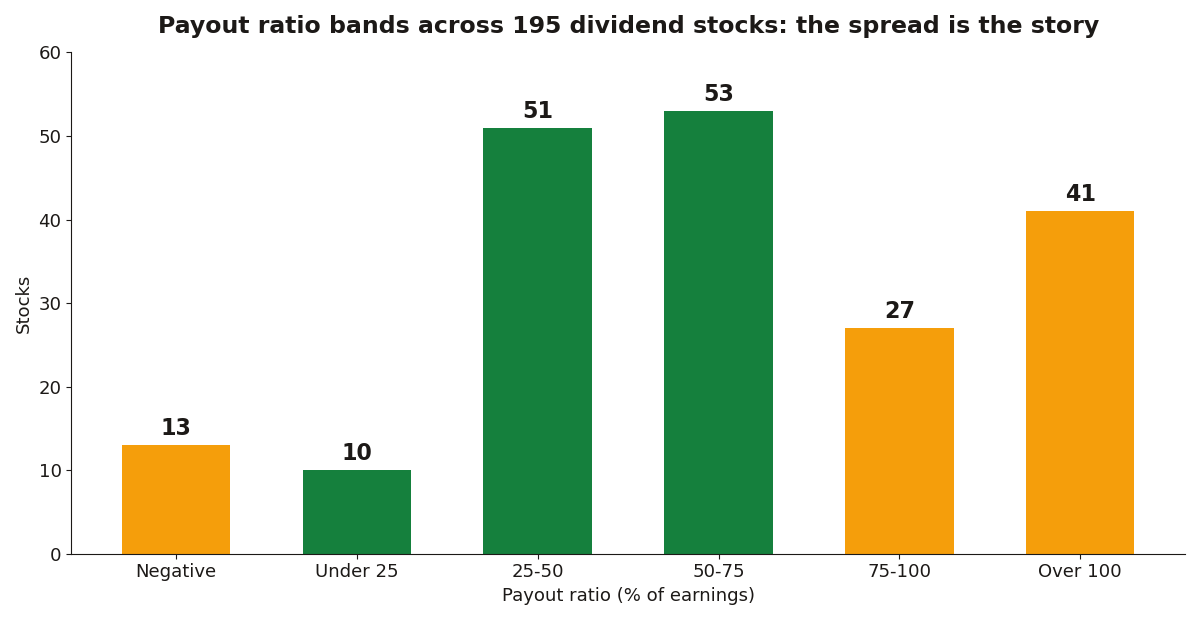
Of the 197 stocks in our database, 195 carry a payout ratio in the Sep 15 snapshot; Stepan and Gilead Sciences have none recorded. The median is 61.8 percent. The comfortable middle is real: 51 stocks pay out 25 to 50 percent of earnings and 53 pay out 50 to 75 percent. The tails are where the reading skill lives. Forty-one stocks pay out more than their earnings, 27 sit between 75 and 100 percent, only 10 pay out under 25 percent, and 13 show a negative ratio.
How to read each band
- Under 60 percent: comfortable for most businesses. Room to grow the dividend and survive bad years.
- 60 to 80 percent: watch closely. Fine for utilities, tight for cyclicals.
- Over 100 percent: the dividend exceeds earnings. Funded by debt, asset sales, or hope, unless the earnings figure itself is the distortion. Cut risk lives here.
- Negative: earnings went below zero in the recorded period, so the ratio flips sign. It says something about one year of earnings, not automatically about the dividend.
The over-100 band needs a footnote before it needs a verdict. Many of its 41 names are REITs, where depreciation crushes reported earnings while the rent still arrives: Realty Income records 237 percent, Iron Mountain 246 percent and Digital Realty 237 percent in this snapshot. For REITs and MLPs, use the free cash flow or funds from operations payout instead, which is harder to fake and much closer to the cash actually available. Outside real estate, an over-100 ratio usually means exactly what it looks like.
The negative band is the mirror image. Air Products shows minus 3,291 percent and General Mills minus 1,356 percent in this snapshot, both after heavy earnings charges, yet Air Products still lifted its annual dividend from $3.31 in 2016 to $7.14 in 2025 according to the history columns. A negative payout ratio is a question about one year's earnings, not proof the dividend is broken.
Real companies, placed in the spread
Middlesex Water pays out 60.0 percent of earnings in this snapshot, right at the database median and textbook for a water utility. The kings median is 57.0 percent across the 43 kings with a recorded ratio, which is why the kings list feels calm: half of the 50-year club pays out less than three-fifths of earnings. Altria runs high by design at 93.6 percent, alongside a 6.4 percent yield; its business is a managed decline, and the ratio tells you the dividend is the business model, not a by-product of it.
And always look at the trend: a ratio climbing from 40 percent to 75 percent over five years is a slow-motion warning, even if today's number looks fine. The history columns in a dividend lookup are what turn a single ratio into that trend, which is why the lookup matters more than the screenshot of one quarter.
Context also travels by sector. A utility paying out 70 percent of earnings is often unremarkable, because regulated revenue barely moves; a cyclical manufacturer at the same 70 percent has no cushion when orders fall. That is why the bands above are a starting grid, not a grading machine. Compare a company first against its own history, then against the 195-stock spread, and only then against a rule of thumb. The lookup gives you all three comparisons; the judgment is still yours to make.
Look it up before you judge it
Every ticker in this database carries its payout ratio next to its yield and streak, so search the database before you repeat anyone's rule of thumb about a stock, including ours. When you are ready to see the ratios in portfolio form, the Dividend Income Builder builds a sample portfolio from a monthly income target and your capital, and each holding can be checked against the bands above in seconds. One number per company, read against 195 others: that is the whole skill. This is educational content, not financial advice.
Sources: Nasdaq, Morningstar